5(i)(a)2026
GraphModerate1 mark
Appeared in 10 of the 11 available papers.
Appears almost every year — treat as core
Average per paper it appears in · 55 marks in total
94% of this chapter's 36 questions
33 questions carry a figure — practise drawing them
Showing 25 of 36 matching questions (55 marks).
25 questions
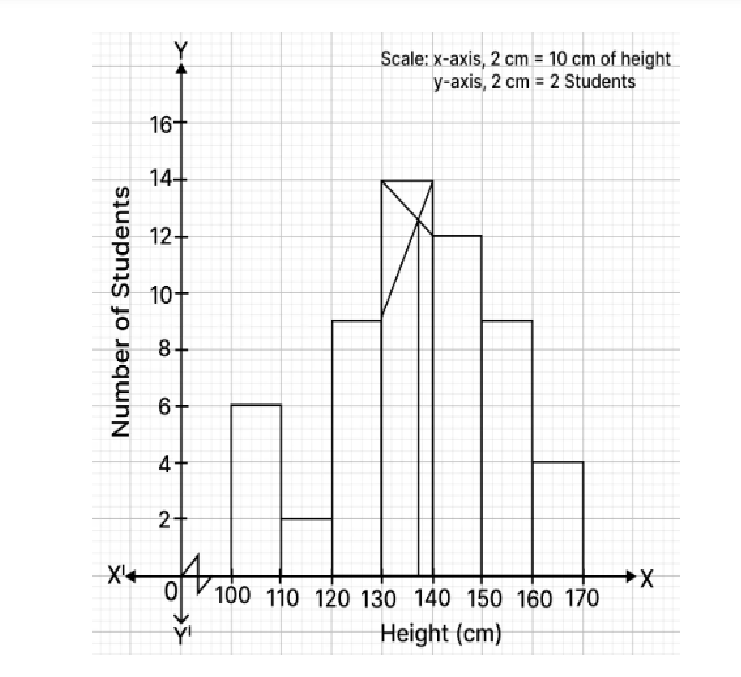
The histogram drawn on the graph represents the number of students of different heights (in cm). Using the graph, answer the following :
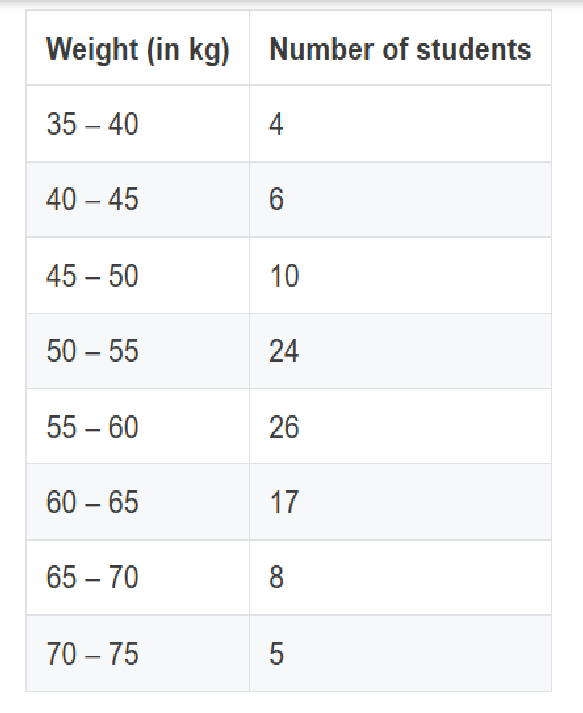
Using a graph paper, draw an ogive for the following distribution which shows a record of weight in kilograms of 100 students. Use your ogive to estimate the following:
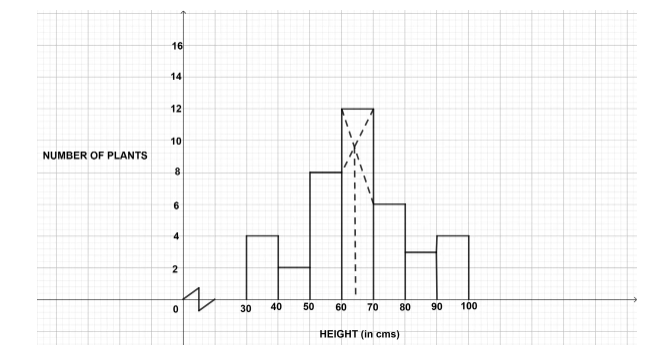
The given graph with a histogram represents the number of plants of different heights grown in a school campus. Study the graph carefully and answer the following questions :
A life insurance agent found the following data for distribution of ages of 100 policy holders:
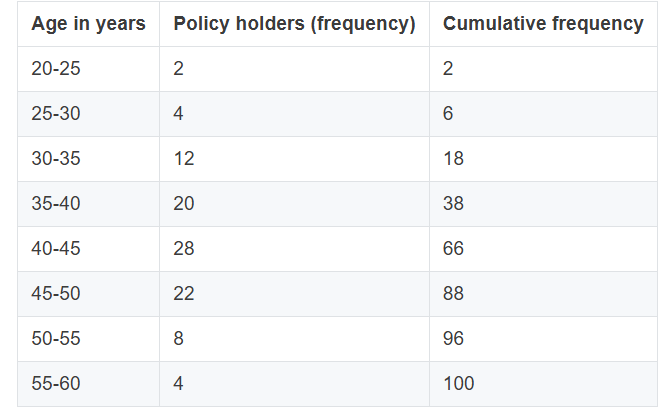
On a graph sheet draw an ogive using the given data. Take 2 cm = 5 years along one axis and 2 cm = 10 policy holders along the other axis. Use your graph to find:
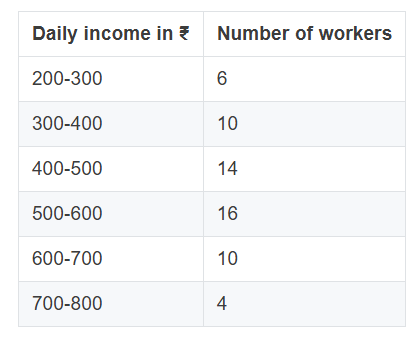
Use graph paper to answer this question. During a medical checkup of 60 students in a school, weights were recorded as follows :
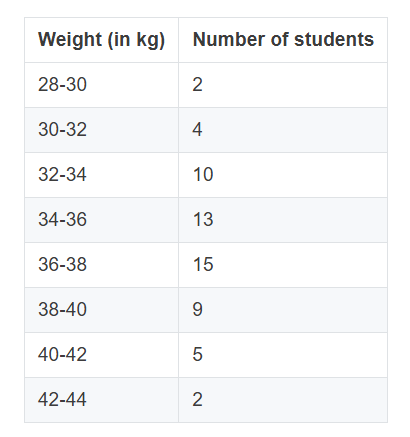
Taking 2 cm = 2 kg along one axis and 2 cm = 10 students along the other axis draw an ogive. Use your graph to find the :
Choose the correct answers to the questions from the given options. (Do not copy the questions, write the correct answers only.)

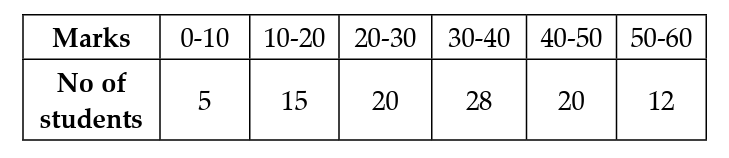
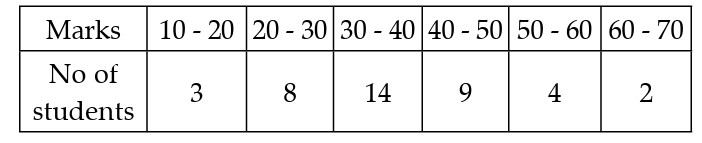
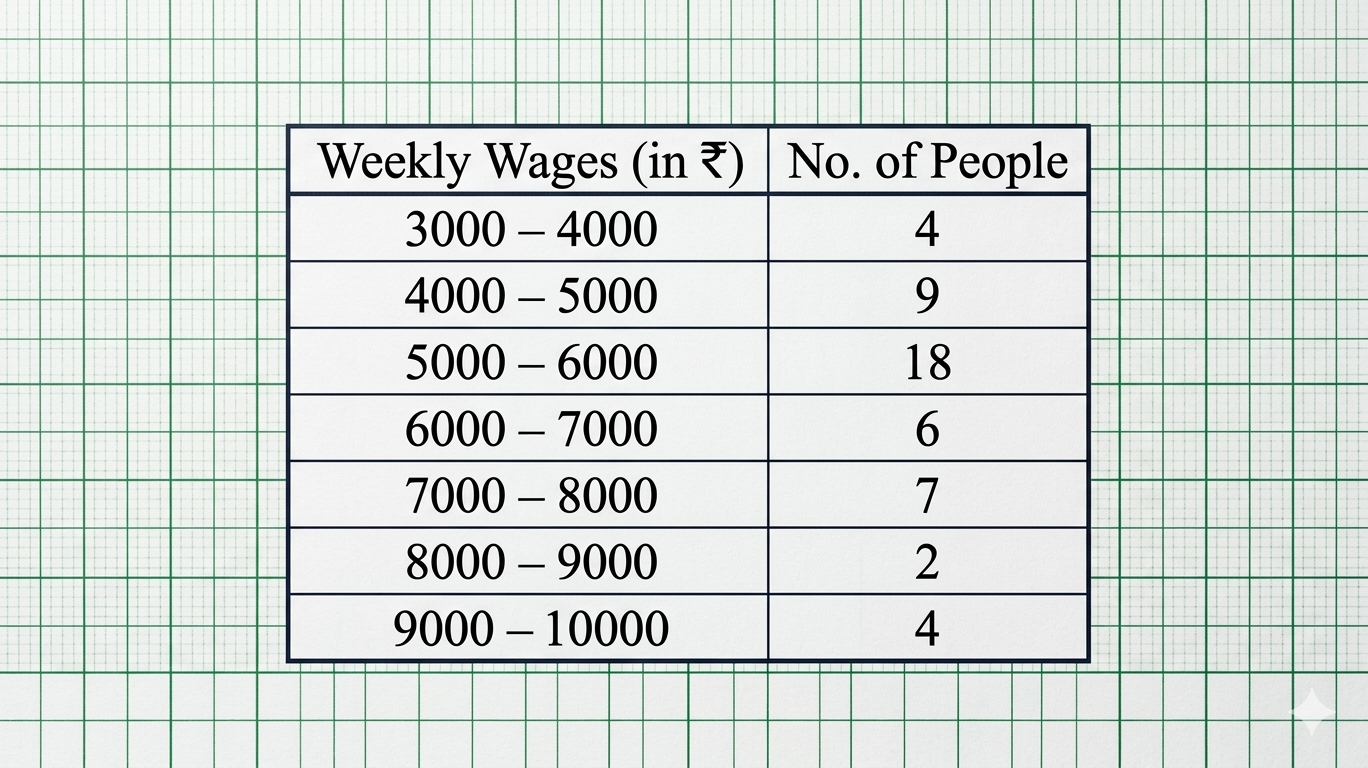
40 students enter for a game of shot-put competition. The distance thrown (in metres) is recorded below:
Use a graph paper to draw an ogive for the above distribution. Use a scale of 2 cm = 1 m on one axis and 2 cm = 5 students on the other axis. Hence using your graph find:
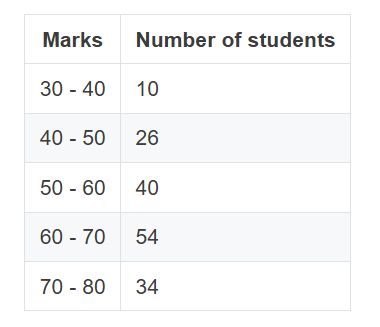
Use graph paper for this question. The marks obtained by 120 students in an English test are given below:

Draw the ogive and hence, estimate: