GraphModerate1 mark
7(ii)
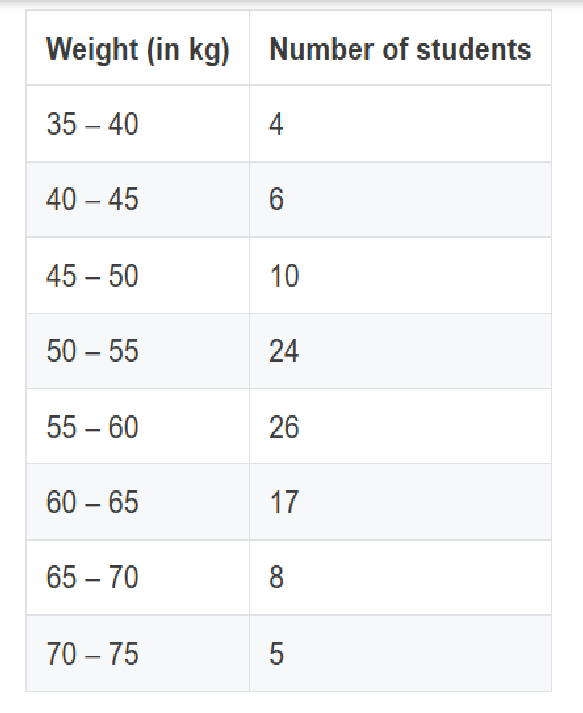
Using a graph paper, draw an ogive for the following distribution which shows a record of weight in kilograms of 100 students. Use your ogive to estimate the following:
the weight above which 20% of the students lie.
Topic: Histogram / ogive / graphical representation
Previous-year question practice database
Answer
Solution diagram
Exam answer
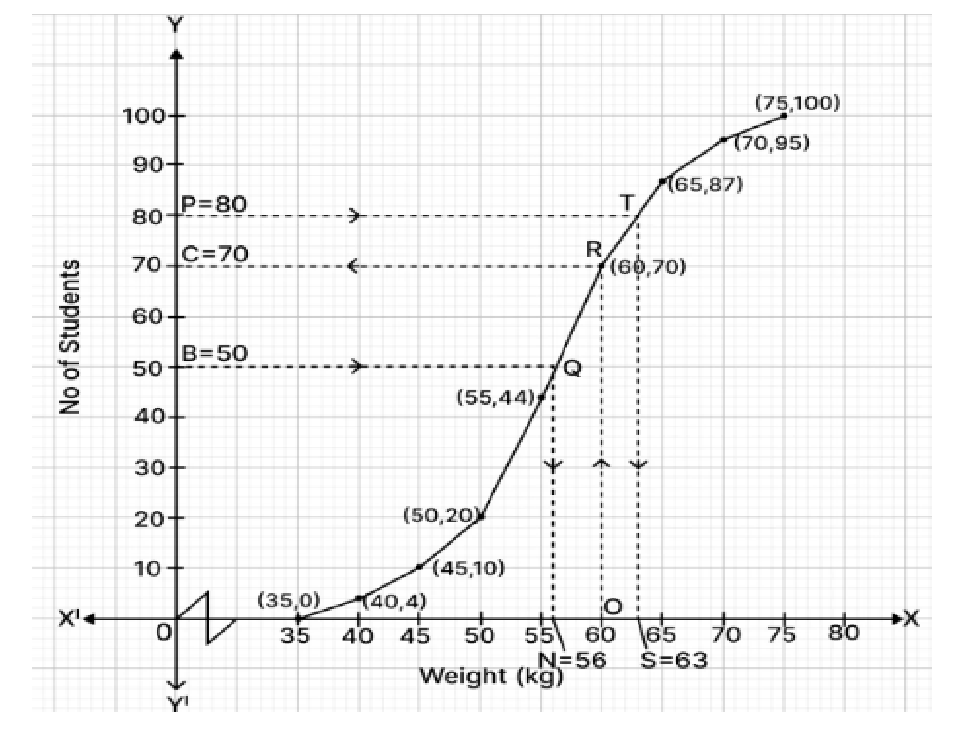
20% of 100 = 20 students are above the required weight. Therefore 80 students are at or below it.
Read the x-value corresponding to c.f. 80 from the ogive.
Answer: Weight ≈ 63 kg.
Explanation
The value above which 20% lie is the 80th percentile. Read c.f. 80 from the ogive.
More from Graphical Representation
the number of students whose height is 150 cm and above.2026the modal height.2026the total number of students.2026the median weight of the students.2026percentage of students whose weight is 60 kg or more.2026Use a graph paper for this question. (Take 2 cm = 10 Marks along one axis and 2 cm = 10 students along another axis). Draw a Histogram for the following distribution which gives the marks obtained by 164 students in a particular class and hence find the Mode.2025