GraphHard3 marks
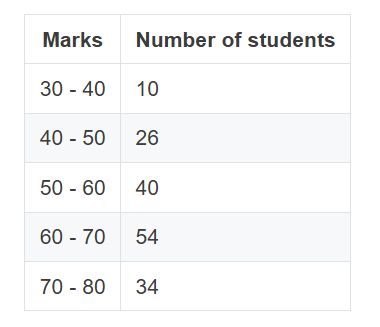
Use a graph paper for this question. (Take 2 cm = 10 Marks along one axis and 2 cm = 10 students along another axis). Draw a Histogram for the following distribution which gives the marks obtained by 164 students in a particular class and hence find the Mode.
Topic: Histogram / ogive / graphical representation
Previous-year question practice database
Answer
Solution diagram
Exam answer
| Marks | Number of students |
|---|---|
| 30–40 | 10 |
| 40–50 | 26 |
| 50–60 | 40 |
| 60–70 | 54 |
| 70–80 | 34 |
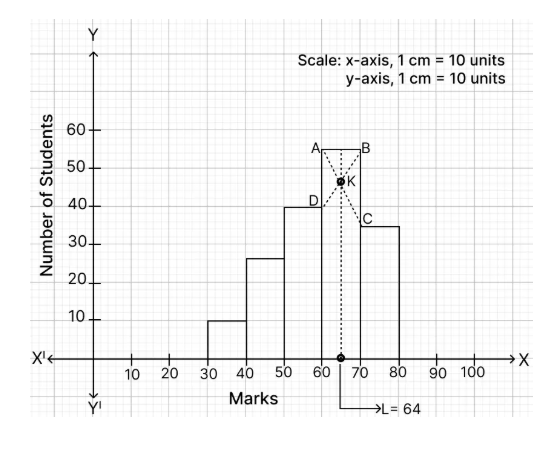
Draw the histogram using the stated scale.
The modal class is 60–70 because it has the highest frequency 54.
Using the standard graphical-mode construction:
Answer: Mode ≈ 64 marks.
Explanation
The frequency table is part of the answer. Draw the histogram first, then use the standard intersecting-lines construction through the modal rectangle and its neighbouring rectangles.