GraphModerate1 mark
7(ii)
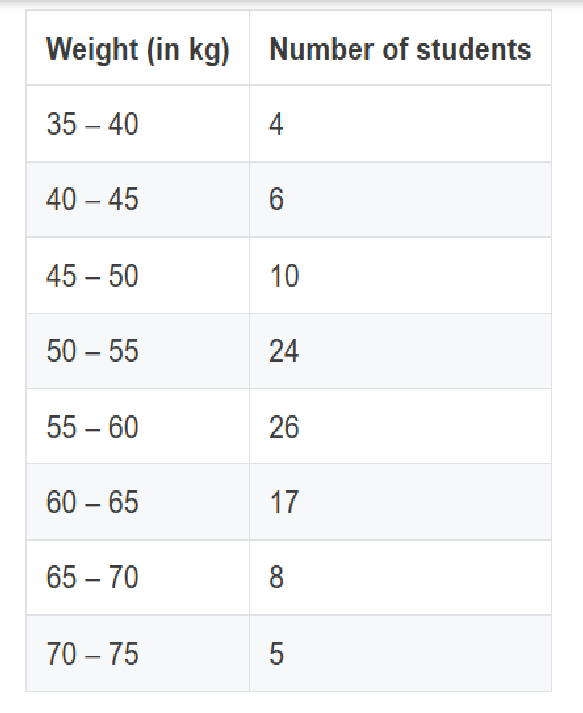
Using a graph paper, draw an ogive for the following distribution which shows a record of weight in kilograms of 100 students. Use your ogive to estimate the following:
percentage of students whose weight is 60 kg or more.
Topic: Histogram / ogive / graphical representation
Previous-year question practice database
Answer
Solution diagram
Exam answer
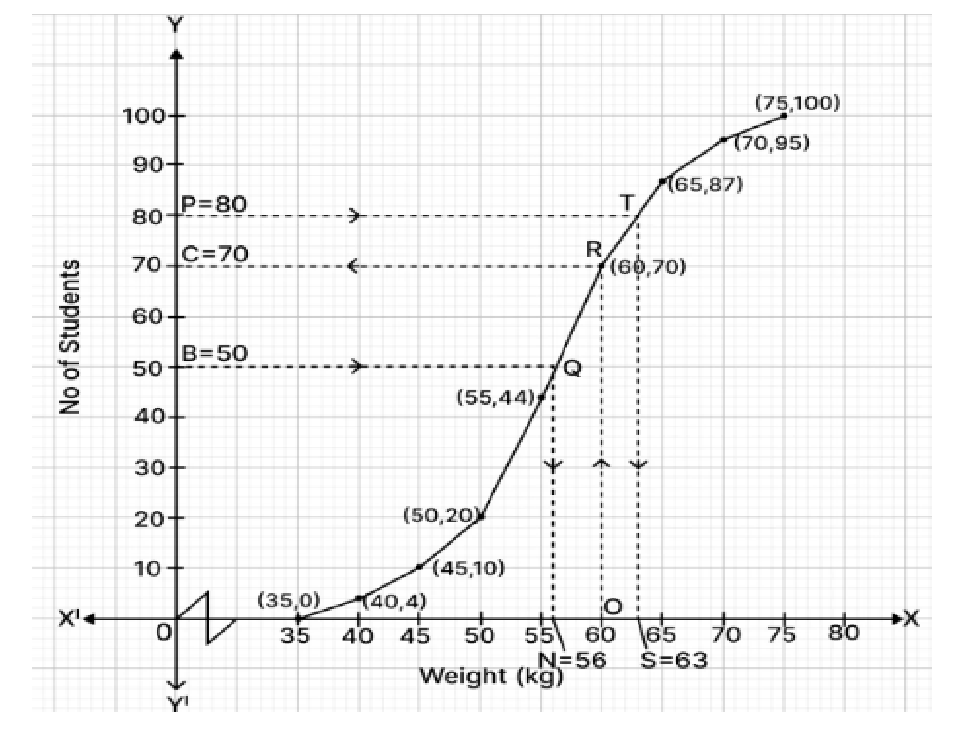
From the ogive at 60 kg: cumulative frequency = 70.
Students weighing 60 kg or more = 100 − 70 = 30.
Percentage = 30/100 × 100 = 30%.
Answer: 30%.
Explanation
Subtract the cumulative frequency below 60 kg from the total, then convert to a percentage.
More from Graphical Representation
the number of students whose height is 150 cm and above.2026the modal height.2026the total number of students.2026the median weight of the students.2026the weight above which 20% of the students lie.2026Use a graph paper for this question. (Take 2 cm = 10 Marks along one axis and 2 cm = 10 students along another axis). Draw a Histogram for the following distribution which gives the marks obtained by 164 students in a particular class and hence find the Mode.2025