GraphModerate2 marks
5(i)
The given graph with a histogram represents the number of plants of different heights grown in a school campus. Study the graph carefully and answer the following questions :
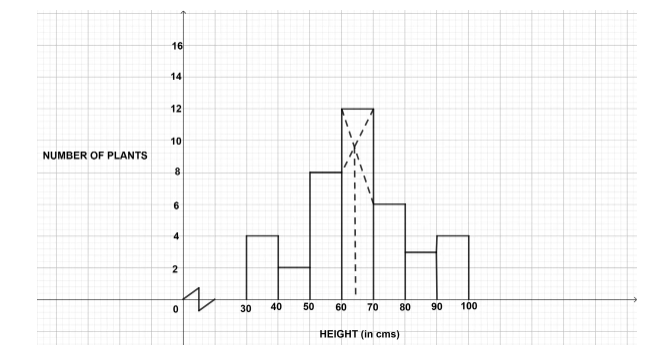
Make a frequency table with respect to the class boundaries and their corresponding frequencies.
Topic: Histogram / ogive / statistical graph
Previous-year question practice database
Answer
Solution diagram
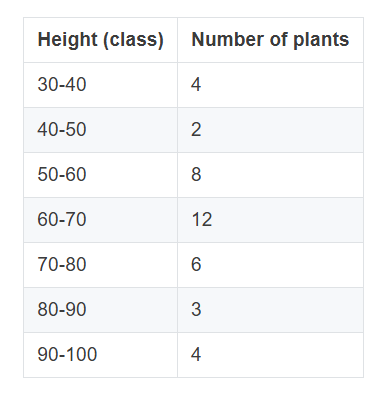
Exam answer
| Height (cm) | Number of plants |
|---|---|
| 30–40 | 4 |
| 40–50 | 2 |
| 50–60 | 8 |
| 60–70 | 12 |
| 70–80 | 6 |
| 80–90 | 3 |
| 90–100 | 4 |
Explanation
The frequency of each class is read from the height of its histogram bar.