GraphHard3 marks
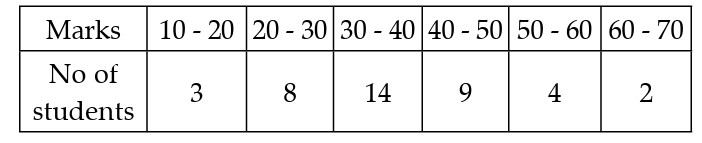
Marks obtained by 40 students in an examination are given below. Using graph paper draw an ogive and estimate the median marks. Take 2 cm = 10 marks along one axis and 2 cm = 5 students along the other axis.
Topic: Histogram / ogive / statistical graph
Previous-year question practice database
Answer
Solution diagram
Exam answer
| Marks | No. of students (f) | Marks less than | Cumulative frequency (c.f.) |
|---|---|---|---|
| 10–20 | 3 | 20 | 3 |
| 20–30 | 8 | 30 | 11 |
| 30–40 | 14 | 40 | 25 |
| 40–50 | 9 | 50 | 34 |
| 50–60 | 4 | 60 | 38 |
| 60–70 | 2 | 70 | 40 |
| Total | Σf = 40 |
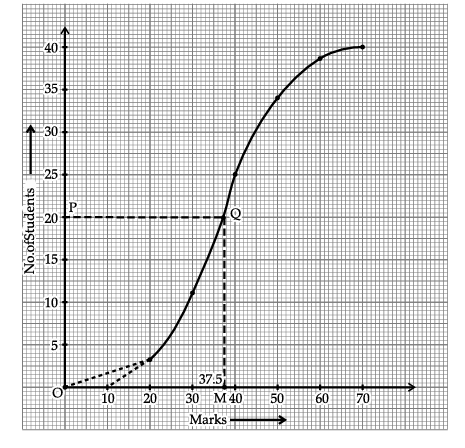
Plot the less-than ogive using: (10,0), (20,3), (30,11), (40,25), (50,34), (60,38), (70,40).
N = 40 Median position = N/2 = 20. Read the x-coordinate corresponding to c.f. 20 from the ogive.
Answer: Median ≈ 37 marks.
Explanation
Prepare the cumulative-frequency table first. The upper class limits are plotted against cumulative frequencies. Since N=40, the median is the 20th observation.