GraphModerate1 mark
5(i)
The given graph with a histogram represents the number of plants of different heights grown in a school campus. Study the graph carefully and answer the following questions :
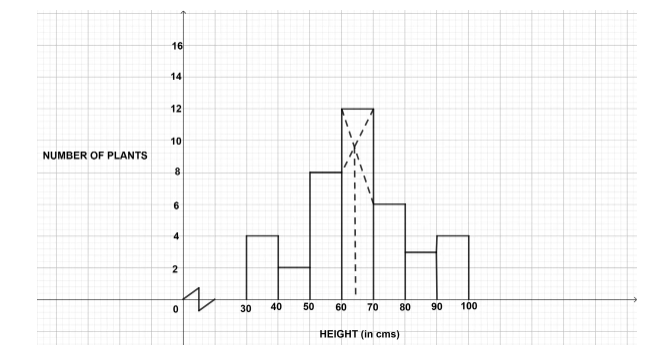
State the modal class.
Topic: Histogram / ogive / statistical graph
Previous-year question practice database
Answer
Solution diagram
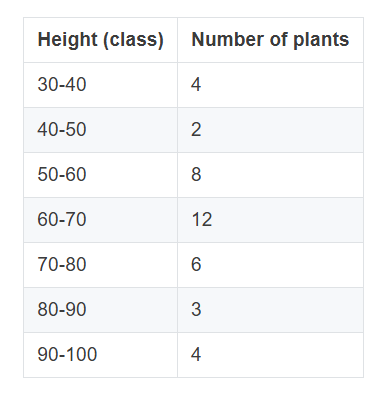
Exam answer
Modal class = 60–70 cm.
Explanation
The modal class is the class interval with the highest frequency. Here the highest frequency is 12.