GraphHard3 marks
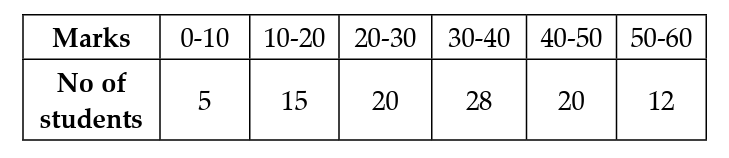
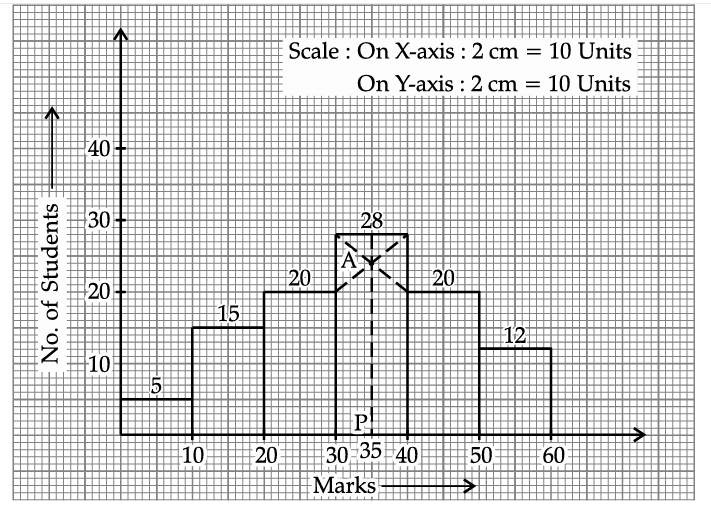
Marks obtained by 100 students in an examination are given below. Draw a histogram for the given data using a graph paper and find the mode. Take 2 cm = 10 marks along one axis and 2 cm = 10 students along the other axis.
Topic: Histogram / ogive / statistical graph
Previous-year question practice database
Answer
Solution diagram
Exam answer
Mode ≈ 35 marks.
Explanation
Draw the histogram using the supplied frequencies. Locate the mode graphically by the standard intersecting-lines method in the modal rectangle.