GraphModerate1 mark
9(iii)
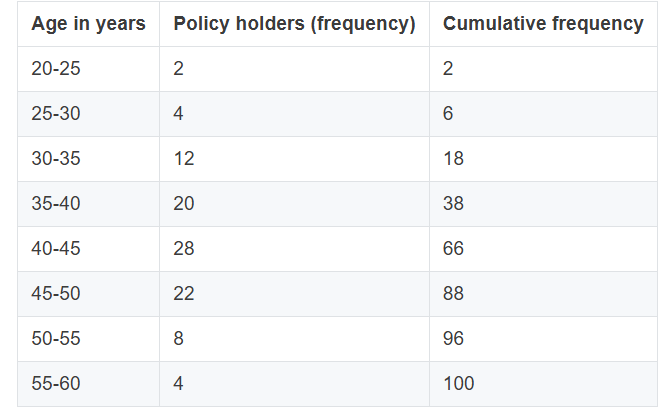
A life insurance agent found the following data for distribution of ages of 100 policy holders: On a graph sheet draw an ogive using the given data. Take 2 cm = 5 years along one axis and 2 cm = 10 policy holders along the other axis. Use your graph to find:
The median age.
Topic: Histogram / ogive / statistical graph
Previous-year question practice database
Answer
Solution diagram
Exam answer
| Age (years) | Policy holders (f) | Cumulative frequency (c.f.) |
|---|---|---|
| 20–25 | 2 | 2 |
| 25–30 | 4 | 6 |
| 30–35 | 12 | 18 |
| 35–40 | 20 | 38 |
| 40–45 | 28 | 66 |
| 45–50 | 22 | 88 |
| 50–55 | 8 | 96 |
| 55–60 | 4 | 100 |
| Total | Σf = 100 |
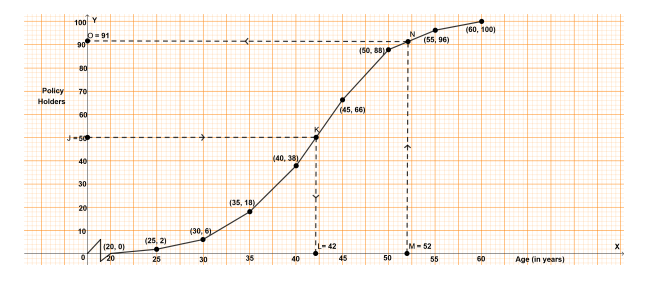
Plot: (20,0), (25,2), (30,6), (35,18), (40,38), (45,66), (50,88), (55,96), (60,100).
N = 100 Median position = N/2 = 50. Reading the ogive at c.f. 50 gives median age ≈ 42 years.
Answer: 42 years.
Explanation
The median is the x-value corresponding to the 50th observation on the less-than ogive.