GraphModerate1 mark
9(iii)
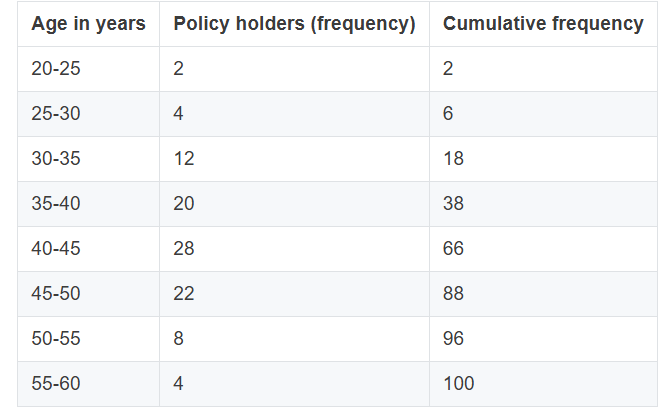
A life insurance agent found the following data for distribution of ages of 100 policy holders: On a graph sheet draw an ogive using the given data. Take 2 cm = 5 years along one axis and 2 cm = 10 policy holders along the other axis. Use your graph to find:
Number of policy holders whose age is above 52 years.
Topic: Histogram / ogive / statistical graph
Previous-year question practice database
Answer
Solution diagram
Exam answer
number of policy holders whose age is above 52 years equal to 9
Explanation
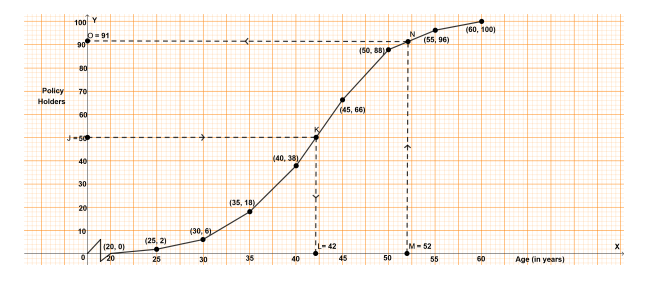
Through M = 52 draw a vertical line to meet the ogive at N. Through N, draw a horizontal line to meet the y-axis at O. The ordinate of the point O represents 91.
Hence, 91 people have their age less than or equal to 52.
∴ No. of people whose age is greater than 52 = 100 - 91 = 9.