GraphHard3 marks
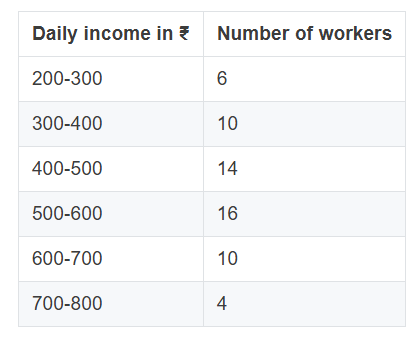
The following distribution gives the daily wages of 60 workers of a factory. Use graph paper to answer this question. Take 2 cm = ₹ 100 along one axis and 2 cm = 2 workers along the other axis. Draw a histogram and hence find the mode of the give distribution.
Topic: Histogram / ogive / statistical graph
Previous-year question practice database
Answer
Solution diagram
Exam answer
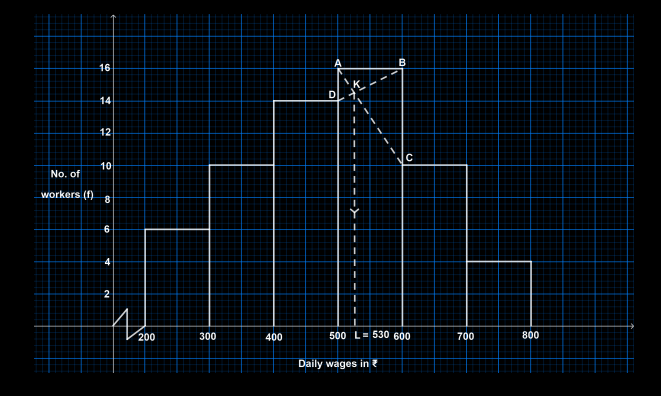
Mode ≈ ₹530.
Explanation
Draw the histogram for the classes 200–300, 300–400, 400–500, 500–600, 600–700, 700–800 with frequencies 6,10,14,16,10,4. Use the standard graphical mode construction in the modal rectangle.