10(a)(ii)2019
GraphModerate1 mark
Appeared in 10 of the 11 available papers.
Appears almost every year — treat as core
Average per paper it appears in · 55 marks in total
94% of this chapter's 36 questions
33 questions carry a figure — practise drawing them
Showing 11 of 36 matching questions (55 marks).
11 questions
Use graph paper for this question. The marks obtained by 120 students in an English test are given below:

Draw the ogive and hence, estimate:

Use Graph paper for this question. A survey regarding height (in cm) of 60 boys belonging to Class 10 of a school was conducted. The following data was recorded:

Taking 2 cm = height of 10 cm along one axis and 2 cm = 10 boys along the other axis draw an ogive of the above distribution. Use the graph to estimate the following:
The daily wages of 80 workers in a project are given below.

Use a graph paper to draw an ogive for the above distribution. (Use a scale of 2 cm = Rs. 50 on x-axis and 2 cm = 10 workers on y-axis). Use your ogive to estimate:
The table shows the distribution of the scores obtained by 160 shooters in a shooting competition. Use a graph sheet and draw an ogive for the distribution. (Take 2 cm = 10 scores on the X-axis and 2 cm = 20 shooters on the Y-axis).

Use your graph to estimate the following:
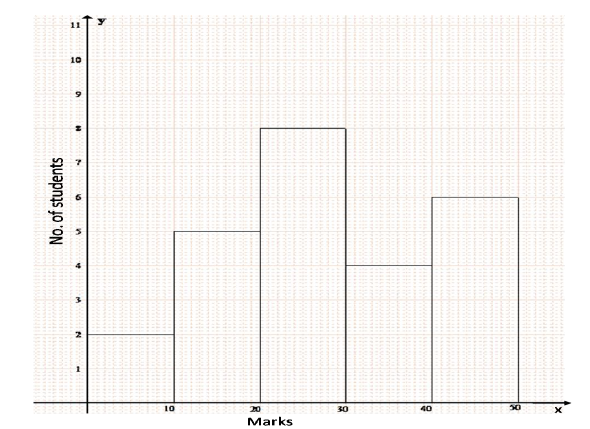
The histogram below represents the scores obtained by 25 students in a mathematics mental test. Use the data to :