GraphHard4 marks
Using a graph paper draw a histogram for the given distribution showing the number of runs scored by 50 batsmen. Estimate the mode of the data:
Topic: Histogram / ogive / statistical graph

Previous-year question practice database
Answer
Solution diagram
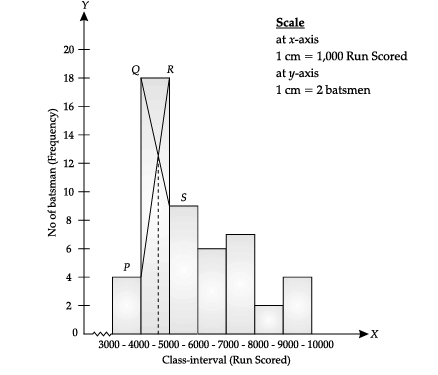
Exam answer
On Y axis: 2 cm = 4 batsmen
Explanation
Mode = 4600 runs Axis and Scale: On X axis: 2 cm = 1000 runs On Y axis: 2 cm = 4 batsmen