GraphModerate2 marks
10(b)
The histogram below represents the scores obtained by 25 students in a mathematics mental test. Use the data to :
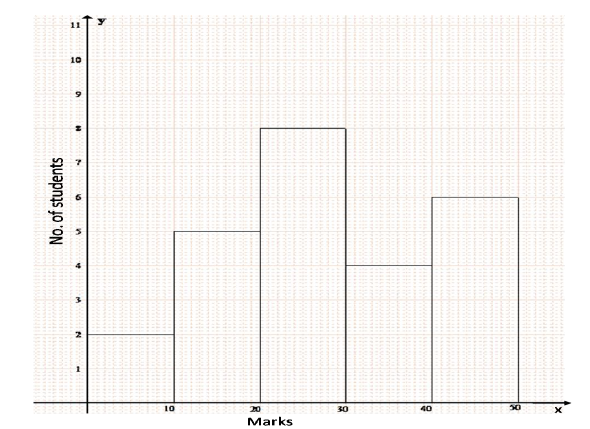
Frame a frequency distribution table
Topic: Histogram / ogive / statistical graph
Previous-year question practice database
Answer
Solution diagram
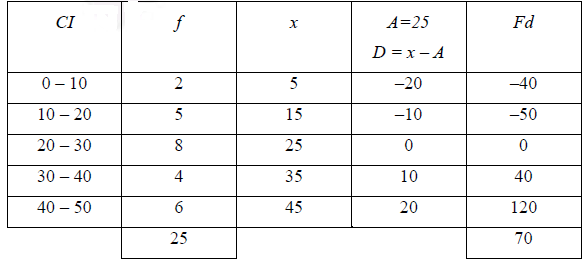
Exam answer
| Marks | Number of students |
|---|---|
| 0–10 | 2 |
| 10–20 | 5 |
| 20–30 | 8 |
| 30–40 | 4 |
| 40–50 | 6 |
| Total | 25 |
Answer: The above is the frequency distribution represented by the histogram.
Explanation
Read the height of each histogram bar as the frequency for its class interval.