GraphModerate1 mark
11(b)
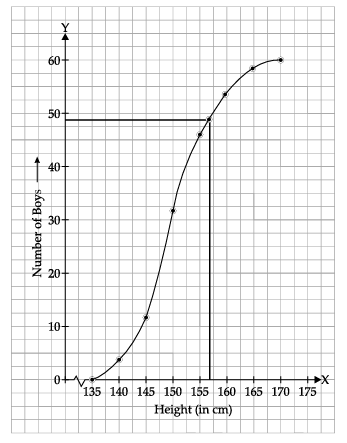
Use Graph paper for this question. A survey regarding height (in cm) of 60 boys belonging to Class 10 of a school was conducted. The following data was recorded: Taking 2 cm = height of 10 cm along one axis and 2 cm = 10 boys along the other axis draw an ogive of the above distribution. Use the graph to estimate the following:

if above 158 cm is considered as the tall boys of the class. Find the number of boys in the class who are tall.
Topic: Histogram / ogive / graphical representation
Previous-year question practice database
Answer
Solution diagram
Exam answer
Total number of boys: N = 60
At a height of 158 cm, the ogive gives a cumulative frequency of approximately 51.
Therefore the number of boys taller than 158 cm is:
60 − 51 = 9
Answer:
9 boys.
Explanation
The cumulative frequency at 158 cm represents boys whose height is up to 158 cm. Subtracting this from the total gives the number taller than 158 cm.