Use Graph paper for this question. A survey regarding height (in cm) of 60 boys belonging to Class 10 of a school was conducted. The following data was recorded: Taking 2 cm = height of 10 cm along one axis and 2 cm = 10 boys along the other axis draw an ogive of the above distribution. Use the graph to estimate the following:

lower Quartile
Topic: Histogram / ogive / graphical representation
Answer
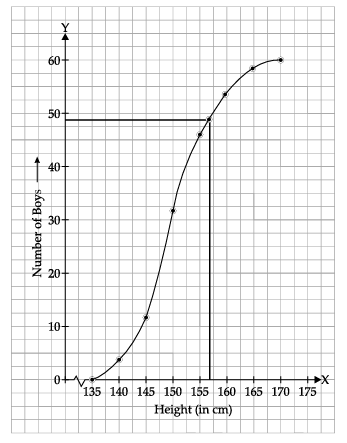
Total number of boys: N = 60
Lower quartile position:
Q₁ = N/4
= 60/4
= 15th observation
From the ogive, the x-coordinate corresponding to cumulative frequency 15 is approximately 146 cm.
Answer:
Lower quartile Q₁ ≈ 146 cm.
The lower quartile is the value below which one-quarter of the observations lie. For N = 60, locate cumulative frequency 15 on the ogive and read the corresponding height.