GraphModerate1 mark
7(b)
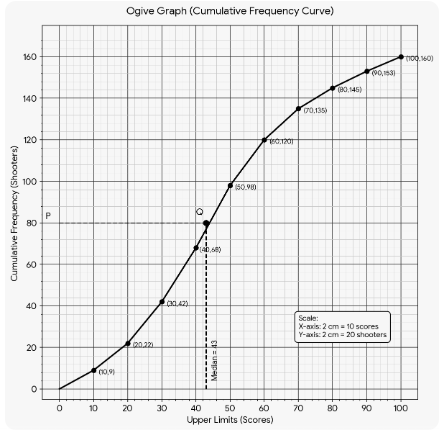
The table shows the distribution of the scores obtained by 160 shooters in a shooting competition. Use a graph sheet and draw an ogive for the distribution. (Take 2 cm = 10 scores on the X-axis and 2 cm = 20 shooters on the Y-axis). Use your graph to estimate the following:

The interquartile range.
Topic: Reflection and plotting
Previous-year question practice database
Answer
Solution diagram
Exam answer
Using the same ogive:
Q₁ position = N/4 = 40th observation. From the graph, Q₁ ≈ 29.
Q₃ position = 3N/4 = 120th observation. From the graph, Q₃ ≈ 60.
Interquartile range = Q₃ − Q₁ ≈ 60 − 29 ≈ 31.
Answer: Interquartile range ≈ 31.
Explanation
Read Q₁ at cumulative frequency 40 and Q₃ at cumulative frequency 120 from the same ogive.