GraphModerate1 mark
10(ii)
Use graph paper to answer this question. During a medical checkup of 60 students in a school, weights were recorded as follows : Taking 2 cm = 2 kg along one axis and 2 cm = 10 students along the other axis draw an ogive. Use your graph to find the :
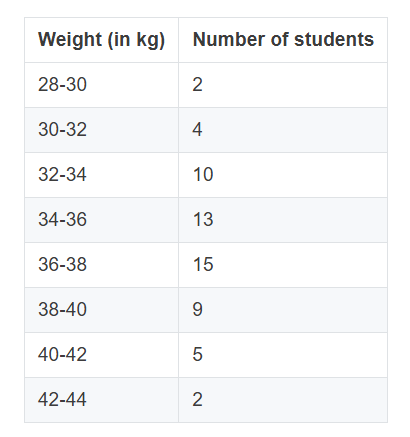
number of students whose weight is above 37 kg.
Topic: Histogram / ogive / statistical graph
Previous-year question practice database
Answer
Solution diagram
Exam answer
| Weight (kg) | Number of students (f) | Cumulative frequency (c.f.) |
|---|---|---|
| 28–30 | 2 | 2 |
| 30–32 | 4 | 6 |
| 32–34 | 10 | 16 |
| 34–36 | 13 | 29 |
| 36–38 | 15 | 44 |
| 38–40 | 9 | 53 |
| 40–42 | 5 | 58 |
| 42–44 | 2 | 60 |
| Total | Σf = 60 |
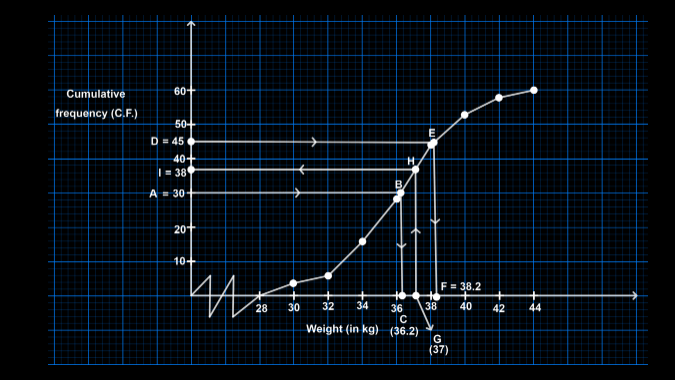
Plot upper class limits against cumulative frequencies: (28,0), (30,2), (32,6), (34,16), (36,29), (38,44), (40,53), (42,58), (44,60).
Use the required cumulative-frequency level on the ogive and read the corresponding weight.
Explanation
The cumulative-frequency table is part of the working and must appear before the ogive. Use the graph only after the table has been prepared.