GraphHard4 marks
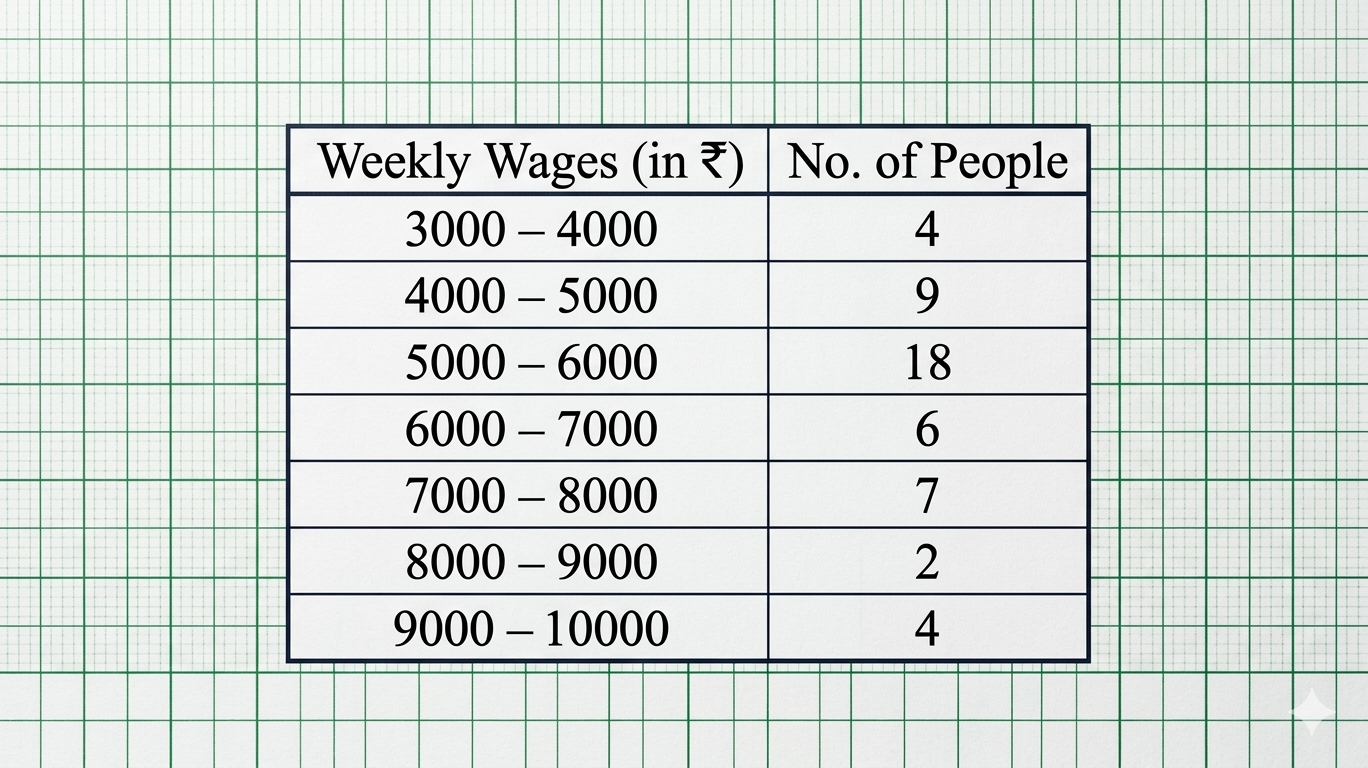
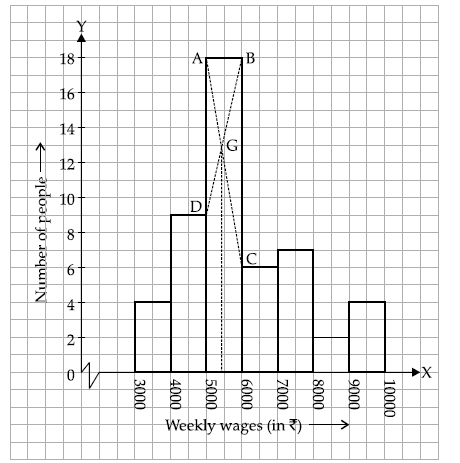
Draw a Histogram for the given data, using a graph paper: Estimate the mode from the graph.
Topic: Histogram / ogive / statistical graph
Previous-year question practice database
Answer
Solution diagram
Exam answer
| Weekly wages (₹) | Number of people |
|---|---|
| 3000–4000 | 4 |
| 4000–5000 | 9 |
| 5000–6000 | 18 |
| 6000–7000 | 6 |
| 7000–8000 | 7 |
| 8000–9000 | 2 |
| 9000–10000 | 4 |
Draw the histogram with the stated class intervals and frequencies.
The modal class is ₹5000–₹6000. Using the standard graphical-mode construction on the histogram:
Answer: Mode ≈ ₹5,400.
Explanation
The modal rectangle is the 5000–6000 class because it has the highest frequency 18. Use the standard graphical-mode construction with the adjacent rectangles.