GraphModerate2 marks
9(a)
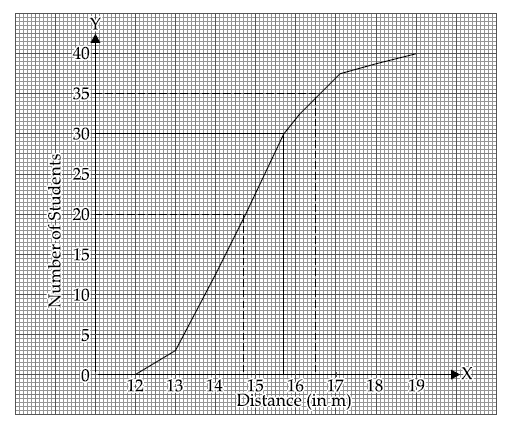
40 students enter for a game of shot-put competition. The distance thrown (in metres) is recorded below: Use a graph paper to draw an ogive for the above distribution. Use a scale of 2 cm = 1 m on one axis and 2 cm = 5 students on the other axis. Hence using your graph find:
the median
Topic: Histogram / ogive / statistical graph
Previous-year question practice database
Answer
Solution diagram
Exam answer
Median = 14.6± 0.2
Explanation
For N = 40 students, the median is the 20th observation. Reading cumulative frequency 20 from the ogive gives approximately 14.6 m.