9(b)(ii)2020
DiagramModerate1.5 marks
Appeared in 11 of the 11 available papers.
Appears almost every year — treat as core
Average per paper it appears in · 135 marks in total
43% of this chapter's 86 questions
9 questions carry a figure — practise drawing them
Showing 25 of 86 matching questions (135 marks).
25 questions
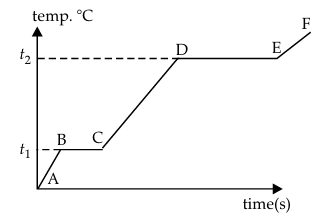
The diagram below shows the change of phases of a substance on a temperature vs time graph on heating the substance at a constant rate.
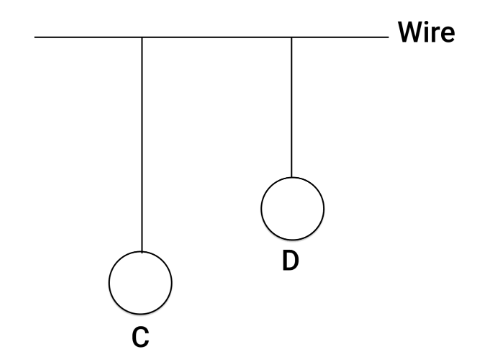
Two pendulums C and D are suspended from a wire as shown in the given figure. Pendulum C is made to oscillate by displacing it from it's mean position. It is seen that D also starts oscillating.