DiagramModerate3 marks
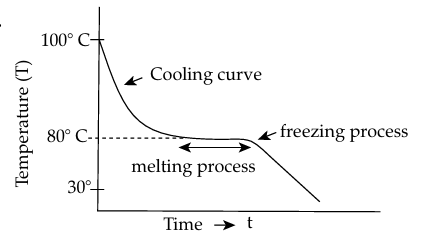
The melting point of naphthalene is 80°C and the room temperature is 30°C. A sample of liquid naphthalene at 100°C is cooled down to the room temperature. Draw a temperature time graph to represent this cooling. In the graph, mark the region which corresponds to the freezing process.
Topic: Heat and calorimetry
Previous-year question practice database
Answer
Solution diagram
Exam answer
Draw a cooling curve falling from 100°C to 80°C, remaining horizontal at 80°C during freezing, then falling from 80°C to 30°C.
More from Calorimetry
A metallic wire is stretched in such a way that its new length becomes twice the original length. How does its specific heat capacity change?
(a) becomes double
(b) becomes 4 times
(c) becomes 1⁄4 times
(d) remains the same2026Three substances A, B and C of same mass are present at their respective melting points. On heating, if they melt completely in 5 minutes, 7 minutes and 3 minutes respectively, then which substance has the highest specific latent heat?
(Assume heat is absorbed at the same rate)
(a) Substance A
(b) Substance B
(c) Substance C
(d) All the substances have same specific latent heat2026The lid of a calorimeter minimises heat loss by ............... [convection / radiation].2026A metal piece of thermal capacity 40 JK-1, absorbs 800 J of heat. Calculate the rise in the temperature of this metal piece.2026Atmospheric temperature after a hailstorm is greater than the temperature during the hailstorm. State True or False.2026Which thermal physical quantity of a frying pan changes by making its base heavier?2026