Short answerEasy1 mark
10(iii)
The given graph represents the monthly salaries (in ₹) of workers of a factory. Using graph answer the following:
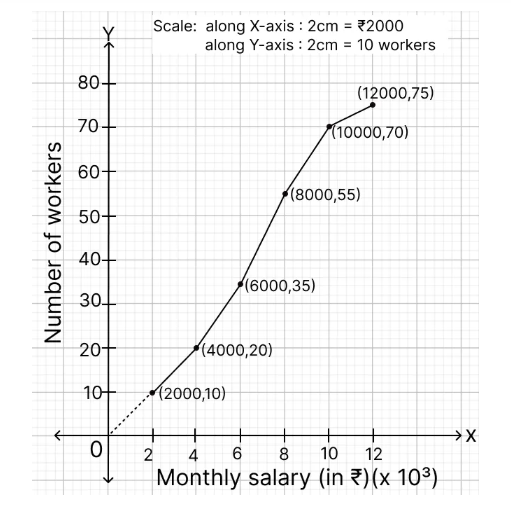
number of workers having monthly salary more than or equal to ₹6,000 but less than ₹10,000.
Topic: Mean / median / mode / quartiles
Previous-year question practice database
Answer
Exam answer
Workers with salary < ₹10,000 = 70. Workers with salary < ₹6,000 = 35.
Required workers = 70 − 35 = 35.
Answer: 35 workers.
Explanation
Use the cumulative-frequency values directly and locate the requested position/range.
More from Measure of Central Tendency (Mean, Median, Quartiles and Mode)
Rakhi’s mobile number has the following integers :
1, 6, 9, 8, 9, 1, 7, 8, 9
The mode of the above given data is :2026Find the mean of the following frequency distribution using step-deviation method.
Take assumed mean = 282026Assertion (A): The mean of first 9 natural numbers is 4.5.
Statement 2: Mean = Sum of all observations / Total number of observations2025mean, to the nearest whole number2025median2025the total number of workers.2025