GraphModerate1 mark
10(b)
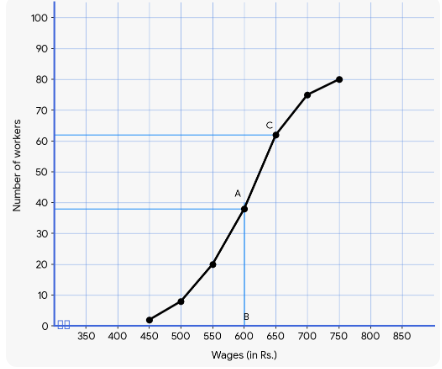
The daily wages of 80 workers in a project are given below. Use a graph paper to draw an ogive for the above distribution. (Use a scale of 2 cm = Rs. 50 on x-axis and 2 cm = 10 workers on y-axis). Use your ogive to estimate:

the lower quartile wage of workers
Topic: Reflection and plotting
Previous-year question practice database
Answer
Solution diagram
Exam answer
Total workers: N = 80
Lower quartile position:
Q₁ corresponds to N/4
= 80/4
= 20th observation
On the ogive, locate cumulative frequency 20 and read the corresponding wage.
The graph gives approximately ₹550.
Answer:
Lower quartile wage ≈ ₹550.
Explanation
The lower quartile is the x-value corresponding to one-quarter of the total cumulative frequency. Here the 20th observation is read from the ogive.
More from Reflection
on the x-axis and name its image as ODEC.2026through the origin and name its image as OIJH.2026on the y-axis and name its image as OFGH2026Plot the given points: A(1, 3), B(1, 2) and C(3, 0).2025Reflect points A and B in x-axis.The image of A under reflection in x-axis is E(1, -3) and image of B under reflection in x-axis is D(1, -2).2025Reflect points A and B through the origin.The image of A under reflection through origin is F(-1, -3) and image of B under reflection through origin is G(-1, -2).2025